- About Us
- Corporate Citizenship
- Corporate Sustainability
Corporate Sustainability Strategy and Governance
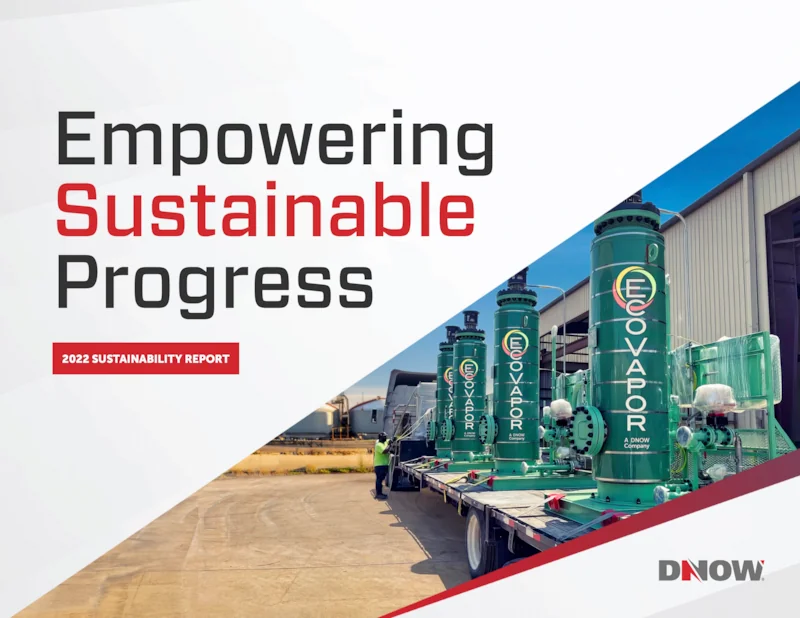
Empowering Sustainable Progress: DNOW’s Commitment to aligning business strategies with ESG goals.
Our 2022 annual sustainability report highlights our dedication to ESG objectives, showcasing our unwavering commitment to transparency, sustainable growth and shared values while emphasizing the tireless efforts of our team to foster a culture of diversity, equity and inclusion. To find out more, download a copy of the report today.
Message from our President & CEO

2022 was a great year for DNOW, as we met the critical needs of our customers grappling with rising inflation and supply chain disruptions in the energy and industrial markets. I am proud that DNOW continues to thrive by remaining focused on our strategic objectives. We take pride in delighting our customers by providing quality products coupled with our unique solutions, deep supply chain expertise, superior customer service and our complementary suite of digital channels.
We align with our customers and deliver results that promote a winning partnership. Our customer-centric approach allows us to provide solutions to operational concerns, like product availability and quality assurance, as we help our customers meet their sustainability goals. Our team places a premium on delivering value to our customers by truly understanding their sustainability challenges and providing customer-specific tailored solutions, backed by technical expertise and supply chain proficiency.
To be a vital part of our customers’ sustainable supply chains, we are high-grading the products and services we offer to improve our customer service through smart planning and focus. In addition, we continue to enhance our geographic reach with deployment of a more efficient fulfillment model through our cohesive regional supercenter footprint.
We are actively pursuing strategic, inorganic investments through acquisitions to complement organic growth. Among the exciting acquisitions we made during 2022 is EcoVapor, whose products have the unique capability to significantly reduce oil and gas and renewable natural gas operators’ greenhouse gas emissions. For example, by using a single EcoVapor E300 oxygen elimination unit at full design capacity, operators have the capability to eliminate up to 16,000 annual metric tons of flared CO e emissions1. Over the course of one year, the positive environmental impact is equivalent to approximately four wind turbines, approximately 3,500 fewer gasoline-powered passenger vehicles driven2 or approximately the equivalent of 2,000 households’ energy use2.
Going forward, we intend to play a more active role in energy evolution. We see additional opportunities to collaborate with our customers to help them meet their environmental goals by upgrading aging infrastructure, adoption of lower-emissions equipment, improved materials management, increased supply chain efficiencies and implementation of our digital offerings. We will continue to be an adaptable partner who prioritizes customer goals by coupling with wide-ranging solutions. With our strong track record of serving customers across the energy value chain through our global network, we are well-positioned to expand into emerging energy markets.
I am excited to present our 2022 annual sustainability report, Empowering Sustainable Progress, which showcases our progress in aligning our business strategy with ESG objectives, enhancing transparency, improving data collection and promoting sustainable growth and shared values. I am particularly proud of the progress by our employees and the achievements we are making by working with our customers and our suppliers, focusing on our employee engagement, diversity, equity, inclusion (“DEI”) and environmental performance.
Our Company
Headquartered in Houston, Texas, DNOW is a premier global provider of energy and industrial products, solutions and engineered equipment. With a rich legacy spanning 160 years, DNOW not only offers a vast range of products through its extensive network and DigitalNOW® platform, optimizing supply chains with procurement and inventory management solutions but also supports customers' sustainability ambitions by promoting carbon and GHG emissions reduction, responsible water use and disposal and engagement in the renewable energy sector.
Our Sustainability Strategy
Who We Are
Our Guiding Principles
- Integrity: We hold ourselves to the highest ethical standards in all that we do.
- Safety: We act with the highest priority on health and safety in our workplace and communities.
- Teamwork: We collaborate with our suppliers, our customers and one another to optimize the sum of all individual efforts, while being active participants in the communities where we live and work.
- Excellence: We are passionate about being the best in the industry, marking our customers priority one and creating long-term value for our stakeholders.
Our Core Values
- We care: We act with compassion and honesty in all that we do. We respect one another, our customers and our communities.
- We do what it takes: We approach every task with energy and passion to make sure the job is done right. We continuously challenge ourselves to provide the highest level of service to our stakeholders.
- We are accountable: We take pride in our work and are responsible for our actions and the outcomes produced.
Our Ethos (Culture)
- Delight The Customer: Be our customers' most trusted partner.
- Inspire One Another: Foster an inclusive, people-first culture.
- Fuel the Future: Win the market and pursue sustainable growth.
How We Empower Sustainable Progress
Our Strategic + ESG Priorities
- Deliver Margin Discipline: High grade product and service offerings, diversified customer base through more balanced energy end-markets, including energy education opportunities in renewable energy, decarbonization and CCUS* projects, biofuels and RNG† and adjacent industrial markets.
- Optimize Operations: Increase efficiency and productivity leveraging technology combined with the continuous optimization of our service network and fulfillment model.
Minimize our impact on the environment - Maximize Working Capital Velocity: Focus capital on high value-add solutions, including development of solutions to help our customers navigate the energy transition.
- Drive Growth Through Acquisitions: Seek margin accretive companies that possess differentiated products and solutions to help our customers meet their net-zero targets.
Our ESG Topics
- Environment: Emissions Reduction Services & Fuels Management, Energy Management, Delivering Sustainable Energy, Delivering Sustainable Solutions To Our Customers
- Social: Employee Engagement & Development, Workforce Diversity & Inclusion, Workforce Health & Safety
- Governance: Corporate Governance Oversight, Business Ethics & Payments Transparency, Supply Chain Stewardship, Management of the Legal & Regulatory Environment, Data Security
* Carbon capture, utilization and storage (CCUS).
† Renewable natural gas (RNG).

2022 GOVERNANCE HIGHLIGHTS
7/8
independent directors on our Board of Directors
2/8
diverse* directors on our Board of Directors
22
manufacturing site audits and 41 desk reassessments of key suppliers conducted in 2022
0
data security breaches
* Diverse indicates directors that are female and/or a member of an underrepresented racial/ethnic group. Board diversity is as of December 31, 2022.

2022 SOCIAL HIGHLIGHTS
>1,650
volunteer hours for organizations our company and employees are passionate about
>95%
of employees participated in psychological safety DEI training
17%
higher communications employee engagement survey score compared to industry benchmark12
0
employee fatalities and TRIR lower than BLS industry averages
13%
higher team dynamics employee engagement survey score compared to industry benchmark12
352
Milestone Awards
* Benchmarks for the Transportation and Warehousing industry from third-party employee survey provider.

2022 ENVIRONMENT HIGHLIGHTS
>32%
decrease in our Scope 1 & 2 GHG emissions intensity from 2021
>11%
decrease in total Scope 1 & 2 GHG emissions from 2021
100%
carbon-neutral parcel shipments for two consecutive years
(see Page 21 for further details)
Acquired EcoVapor and its ZerO2TM technology, which enables operators to reduce up to 16,000 annual metric tons of CO2e emissions through the continual use of one E300 oxygen elimination unit yielding improved gas capture, where otherwise the gas would have been combusted and emitted to the atmosphere
(see Page 36 for further details)

About This Report
The information included in this report is subject to DNOW’s policies and requirements surrounding the disclosure of financial and non-financial data. The financial information included in this report was sourced from our Form 10-K filed with the SEC on February 16, 2023. All non-financial data included in this report was not subject to a third-party audit verification process.

Forward-Looking Statements
Certain information contained in this Sustainability Report may constitute forward-looking statements within the meaning of applicable securities laws, including, but not limited to, statements regarding our plans to: move forward with identified climate change opportunities, foster programs regarding diversity and inclusion and plans to seek opportunities to further integrate sustainability factors into investment decisions. Readers are cautioned not to place undue reliance on forward-looking statements, as they are subject to a number of assumptions and known and unknown risks and uncertainties that may cause the actual results, performance or achievements of DNOW to be materially different from any future results, performance or achievements expressed or implied by such forward-looking statements. The forward-looking statements contained herein are made as of the date of this document. We also describe risks and uncertainties in our reports filed with the SEC, including our Form 10-K for the year-ended December 31, 2022 (under the headings “Risk Factors” and “Information Regarding Forward- Looking Statements” and elsewhere) and our subsequent reports, which are available through the SEC’s EDGAR system at www. sec.gov, and on our website at dnow.com. DNOW assumes no obligation to update or otherwise revise these forward-looking statements, whether as a result of new information, future events, or otherwise.
SASB Index
The Sustainability Accounting Standards Board (“SASB”) framework aims to provide a standard for companies to disclose financially-material and decision- useful ESG information to investors and other stakeholders. The index below maps our performance under each of the suggested disclosure topics for the following two industries:
- Oil & Gas Services (Code EM-SV)
- Multiline and Specialty Retailers & Distributors (Code CG-MR)
According to SASB’s Sustainable Industry Classification System (SICS®), these two industry standards most accurately reflect our business operations. Other topics disclosed throughout this report beyond the scope of these standards are not reflected in this index.
| CODE | ACCOUNTING METRIC | UNIT OF MEASURE | 2021 RESPONSE | 2020 RESPONSE | 2019 RESPONSE |
| Greenhouse Gas Emissions | |||||
| EM-SV-110a.1 | Total fuel consumed | Gigajoules (GJ) | 216,873 |
248,228 |
286,930 |
| Metric tons carbon dioxide equivalent (MT CO2e) |
15,402 |
16,623 |
20,444 |
||
| Percentage renewable | Percentage (%) | 0% | 0% | 0% | |
| Percentage used in on-road equipment and vehicles | Percentage (%) | 99.8% | 99.8% | 99.7% | |
| Percentage used in off-road equipment | Percentage (%) | 0.2% | 0.2% | 0.3% | |
| EM-SV-110a.2 | Discussion of strategy or plans to address air emissions-related risks, opportunities, and impacts | N/A | Pages 35-42 | See 2021 Report | See 2021 Report |
| CODE | ACCOUNTING METRIC | UNIT OF MEASURE | 2021 RESPONSE | 2020 RESPONSE | 2019 RESPONSE |
| Energy Management | |||||
|
CG-MR-130a.1 |
Total electricity consumed |
Gigajoules (GJ) |
60,470 |
69,358 |
71,026 |
|
Metric tons carbon dioxide equivalent (MT CO2e) |
7,896 |
8,247 |
10,219 |
||
|
Total natural gas consumed |
Gigajoules (GJ) |
74,891 |
112,104 |
82,081 |
|
|
Metric tons carbon dioxide equivalent (MT CO2e) |
3,841 |
5,683 |
4,156 |
||
|
Total energy consumed |
Gigajoules (GJ) |
135,361 |
181,462 |
153,107 |
|
|
Percentage energy consumed that is grid electricity1 |
Percentage (%) |
45% |
38% |
46% |
|
|
Employee Health & Safety |
|||||
|
EM-SV-320a.1 |
Total recordable incident rate (TRIR) |
Rate |
0.94 |
0.92 |
0.91 |
|
Fatality rate |
Rate |
0 | 0 | 0 | |
|
Near miss frequency rate (NMFR) |
Rate |
Not Disclosed |
Not Disclosed |
Not Disclosed |
|
|
Total vehicle incident rate (TVIR) |
Rate |
0.86 |
0.80 |
0.63 |
|
|
Average hours of health, safety, and emergency response training for (a) full- time employees, (b) contract employees, and (c) short- service employees |
Hours |
Not available |
Not available |
Not available |
|
1 Calculated as purchased grid electricity consumption divided by total energy consumption, which includes natural gas consumption.
| CODE | ACCOUNTING METRIC | UNIT OF MEASURE | 2021 RESPONSE | 2020 RESPONSE | 2019 RESPONSE |
| EM-SV-320a.2 | Description of management systems used to integrate a culture of safety throughout the value chain and project lifecycle | N/A | Pages 26-27 | See 2021 Report | See 2020 Report |
| Data Security | |||||
| CG-MR-230a.1 | Description of approach to identifying and addressing data security risks | N/A | Page 24 | See 2021 Report | See 2020 Report |
| CG-MR-230a.2 CG-MR-230a.2 |
Number of data breaches | Number | 0 | 0 | 0 |
| Percentage involving personally identifiable information | Percentage (%) | 0% | 0% | 0% | |
| Number of customers affected | Number | 0 | 0 | 0 | |
| Labor Practices | |||||
| CG-MR-310a.3 | Total amount of monetary losses as a result of legal proceedings associated with labor law violations | Dollars ($) | See note 2 below | See note 2 below | See note 2 below |
| Employee Engagement, Diversity & Inclusion | |||||
| CG-MR-330a.1 | Percentage of gender and racial/ethnic group representation for (1) management and (2) all other employees | Percentage (%) | Pages 32 | See 2021 Report | See 2020 Report |
| CG-MR-330a.2 | Total amount of monetary losses as a result of legal proceedings associated with employment discrimination | Dollars ($) | See note 2 below | See note 2 below | See note 2 below |
2 Total monetary paid losses resulting from legal proceedings related to claims which contained allegations of employment discrimination or labor law violations for the year ending December 31, 2022 were less than $815K, or 0.22% of total warehousing, selling and administrative expenses.
| CODE | ACCOUNTING METRIC | UNIT OF MEASURE | 2021 RESPONSE | 2020 RESPONSE | 2019 RESPONSE |
| Business Ethics | |||||
| EM-SV-510a.1 | Amount of net revenue in countries that have the 20 lowest rankings in Transparency International’s Corruption Perception Index |
Percentage (%) of Total Revenues | 0.23% | 0.15% | 0.07% |
| EM-SV-510a.2 | Description of the management system for prevention of corruption and bribery throughout the value chain | N/A | Pages 18 | See 2021 Report | See 2020 Report |
| Critical Incident Risk Management | |||||
| EM-SV-540a.1 | Description of management systems used to identify and mitigate catastrophic and tail-end risks | N/A | Page 13, 15 | See 2021 Report | See 2020 Report |
| Product Design & Lifecycle Management | |||||
| CG-MR-410a.1 | Revenue from products third-party certified to environmental and/or social sustainability standards | Dollars ($) | Not available | Not available | Not available |
| CG-MR-410a.3 | Discussion of strategies to reduce the environmental impact of packaging | N/A | Pages 19-21 | See 2021 Report | See 2020 Report |
| Management of the Legal & Regulatory Environment | |||||
| EM-SV-530a.1 | Discussion of corporate positions related to government regulations and/or policy proposals that address environmental and social factors affecting the industry | N/A | Pages 15-17 | See 2021 Report | See 2020 Report |
| CODE | ACCOUNTING METRIC | UNIT OF MEASURE | 2021 RESPONSE | 2020 RESPONSE | 2019 RESPONSE |
| CG-MR-000.A | Number of retail locations | Number | 170 | 180 | 195 |
| Number of regional fulfillment centers | Number | 9 | 8 | 8 | |
| CG-MR-000.B | Total area of retail space | Square meters (m2) | 267,629 | 254,958 | 321,759 |
| Total area of regional fulfillment centers | Square meters (m2) | 91,552 | 87,836 | 87,836 |
TCFD INDEX
We are committed to increasing transparency and alignment of our reporting with the recommendations established by the Task Force on Climate-Related Financial Disclosures ("TCFD"). The TCFD has developed voluntary, consistent climate-related financial risk disclosures for use in providing information to stakeholders. Below is a summary of these disclosures in this report.
| CATEGORY | TCFD RECOMMENDATION | SUPPORTING RECOMMENDED DISCLOSURE | LOCATION OF DISCLOSURE |
|---|---|---|---|
| Governance | Disclose the organization's governance around climate-related risks and opportunities. | a) Describe the board's oversight of climate-related risks and opportunities. | Corporate Governance Oversight, Page 13 |
| b) Describe management's role in assessing and managing climate-related risks and opportunities. | |||
| Strategy | Disclose the actual and potential impacts of climate- related risks and opportunities on the organization’s businesses, strategy, and financial planning where such information is material. | a) Describe the climate-related risks and opportunities the organization has identified over the short-, medium-, and long-term. | Managing Risks & Opportunities, Page 15 Management of the Legal & Regulatory Environment, Page 17 |
| b) Describe the impact of climate-related risks and opportunities on the organization’s businesses, strategy, and financial planning. | |||
| c) Describe the resilience of the organization’s strategy, taking into consideration different climate-related scenarios, including a 2°C or lower scenario. | At this time, DNOW has not conducted a 2°C or lower scenario analysis. We are, however, committed to continuing to enhance our understanding of climate-related risks and opportunities and the ways in which they impact our business, strategy, and financial planning, and will assess this initiative in the future. | ||
| Risk Management | Disclose how the organization identifies, assesses, and manages climate-related risks. |
a) Describe the board’s oversight of climate- related risks and opportunities. | Managing Risks & Opportunities, Page 15 |
| b) Describe the organization’s processes for managing climate-related risks. | Management of the Legal & Regulatory Environment, Page 17 | ||
| c) Describe how processes for identifying, assessing, and managing climate-related risks are integrated into the organization’s overall risk management. | |||
| Metrics & Targets | Disclose the metrics and targets used to assess and manage relevant climate-related risks and opportunities where such information is material. | a) Disclose the metrics used by the organization to assess climate-related risks and opportunities in line with its strategy and risk management process. | SASB Index. Page 44 |
| b) Disclose Scope 1, Scope 2, and, if appropriate, Scope 3 GHG emissions, and the related risks. | |||
| c) Describe the targets used by the organization to manage climate-related risks and opportunities and performance against targets. | We have not yet set climate-specific targets, as we’re focused on establishing our GHG emissions baseline and enhancing our approach to ESG data collection. We will continue to evaluate the feasibility and relevance of setting climate-specific targets in the future. |
UN SDG Alignment
| UN SDG Topic | UN Sustainable Development Goal | DNOW Goal Progress and Key Performance Indicators | Section, Page # |
 |
Ensure healthy lives and promote well-being for all. |
|
Workforce Health & Safety |
 |
Ensure inclusive and equitable quality education and promote lifelong learning opportunities for all. |
|
Employee Engagement & Development |
 |
Achieve gender equality and empower all women and girls. |
|
Corporate Governance Oversight Workforce Diversity & Inclusion |
 |
Ensure access to affordable, reliable, sustainable and modern energy for all. |
|
Supply Chain Stewardship Page 19 Delivering Sustainable Energy |
 |
Promote sustained, inclusive and sustainable economic growth, full and productive employment and decent work for all |
|
Corporate Governance Oversight Supply Chain Stewardship Page 19 Workforce Health & Safety Workforce Diversity & Inclusion |
 |
Build resilient infrastructure, promote inclusive and sustainable industrialization and foster innovation. |
|
Supply Chain Stewardship Page 19 Delivering Sustainable Energy |
 |
Ensure sustainable consumption and production patterns. |
|
Supply Chain Stewardship Page 19 DNOW Environmental Performance Page 41 |
 |
Take urgent action to combat climate change and its impacts. |
|
Managing Risks & Opportunities Page 15 Supply Chain Stewardship Page 19 Delivering Sustainable Energy DNOW Environmental Performance TCFD Index Page 49 |

|
Promote peaceful and inclusive societies for sustainable development, provide access to justice for all and build effective, accountable and inclusive institutions at all levels. |
|
Corporate Governance Oversight Business Ethics & Payments Transparency Page 18 |

|
Strengthen the means of implementation and revitalize the global partnership for sustainable development. |
|
Our Sustainability Reporting Framework Page 10 UN SDG Alignment Page 50 |
Message from our President & CEO

2022 was a great year for DNOW, as we met the critical needs of our customers grappling with rising inflation and supply chain disruptions in the energy and industrial markets. I am proud that DNOW continues to thrive by remaining focused on our strategic objectives. We take pride in delighting our customers by providing quality products coupled with our unique solutions, deep supply chain expertise, superior customer service and our complementary suite of digital channels.
We align with our customers and deliver results that promote a winning partnership. Our customer-centric approach allows us to provide solutions to operational concerns, like product availability and quality assurance, as we help our customers meet their sustainability goals. Our team places a premium on delivering value to our customers by truly understanding their sustainability challenges and providing customer-specific tailored solutions, backed by technical expertise and supply chain proficiency.
To be a vital part of our customers’ sustainable supply chains, we are high-grading the products and services we offer to improve our customer service through smart planning and focus. In addition, we continue to enhance our geographic reach with deployment of a more efficient fulfillment model through our cohesive regional supercenter footprint.
We are actively pursuing strategic, inorganic investments through acquisitions to complement organic growth. Among the exciting acquisitions we made during 2022 is EcoVapor, whose products have the unique capability to significantly reduce oil and gas and renewable natural gas operators’ greenhouse gas emissions. For example, by using a single EcoVapor E300 oxygen elimination unit at full design capacity, operators have the capability to eliminate up to 16,000 annual metric tons of flared CO e emissions1. Over the course of one year, the positive environmental impact is equivalent to approximately four wind turbines, approximately 3,500 fewer gasoline-powered passenger vehicles driven2 or approximately the equivalent of 2,000 households’ energy use2.
Going forward, we intend to play a more active role in energy evolution. We see additional opportunities to collaborate with our customers to help them meet their environmental goals by upgrading aging infrastructure, adoption of lower-emissions equipment, improved materials management, increased supply chain efficiencies and implementation of our digital offerings. We will continue to be an adaptable partner who prioritizes customer goals by coupling with wide-ranging solutions. With our strong track record of serving customers across the energy value chain through our global network, we are well-positioned to expand into emerging energy markets.
I am excited to present our 2022 annual sustainability report, Empowering Sustainable Progress, which showcases our progress in aligning our business strategy with ESG objectives, enhancing transparency, improving data collection and promoting sustainable growth and shared values. I am particularly proud of the progress by our employees and the achievements we are making by working with our customers and our suppliers, focusing on our employee engagement, diversity, equity, inclusion (“DEI”) and environmental performance.
Our Company
Headquartered in Houston, Texas, DNOW is a premier global provider of energy and industrial products, solutions and engineered equipment. With a rich legacy spanning 160 years, DNOW not only offers a vast range of products through its extensive network and DigitalNOW® platform, optimizing supply chains with procurement and inventory management solutions but also supports customers' sustainability ambitions by promoting carbon and GHG emissions reduction, responsible water use and disposal and engagement in the renewable energy sector.
Our Sustainability Strategy
Who We Are
Our Guiding Principles
- Integrity: We hold ourselves to the highest ethical standards in all that we do.
- Safety: We act with the highest priority on health and safety in our workplace and communities.
- Teamwork: We collaborate with our suppliers, our customers and one another to optimize the sum of all individual efforts, while being active participants in the communities where we live and work.
- Excellence: We are passionate about being the best in the industry, marking our customers priority one and creating long-term value for our stakeholders.
Our Core Values
- We care: We act with compassion and honesty in all that we do. We respect one another, our customers and our communities.
- We do what it takes: We approach every task with energy and passion to make sure the job is done right. We continuously challenge ourselves to provide the highest level of service to our stakeholders.
- We are accountable: We take pride in our work and are responsible for our actions and the outcomes produced.
Our Ethos (Culture)
- Delight The Customer: Be our customers' most trusted partner.
- Inspire One Another: Foster an inclusive, people-first culture.
- Fuel the Future: Win the market and pursue sustainable growth.
How We Empower Sustainable Progress
Our Strategic + ESG Priorities
- Deliver Margin Discipline: High grade product and service offerings, diversified customer base through more balanced energy end-markets, including energy education opportunities in renewable energy, decarbonization and CCUS* projects, biofuels and RNG† and adjacent industrial markets.
- Optimize Operations: Increase efficiency and productivity leveraging technology combined with the continuous optimization of our service network and fulfillment model.
Minimize our impact on the environment - Maximize Working Capital Velocity: Focus capital on high value-add solutions, including development of solutions to help our customers navigate the energy transition.
- Drive Growth Through Acquisitions: Seek margin accretive companies that possess differentiated products and solutions to help our customers meet their net-zero targets.
Our ESG Topics
- Environment: Emissions Reduction Services & Fuels Management, Energy Management, Delivering Sustainable Energy, Delivering Sustainable Solutions To Our Customers
- Social: Employee Engagement & Development, Workforce Diversity & Inclusion, Workforce Health & Safety
- Governance: Corporate Governance Oversight, Business Ethics & Payments Transparency, Supply Chain Stewardship, Management of the Legal & Regulatory Environment, Data Security
* Carbon capture, utilization and storage (CCUS).
† Renewable natural gas (RNG).

2022 GOVERNANCE HIGHLIGHTS
7/8
independent directors on our Board of Directors
2/8
diverse* directors on our Board of Directors
22
manufacturing site audits and 41 desk reassessments of key suppliers conducted in 2022
0
data security breaches
* Diverse indicates directors that are female and/or a member of an underrepresented racial/ethnic group. Board diversity is as of December 31, 2022.

2022 SOCIAL HIGHLIGHTS
>1,650
volunteer hours for organizations our company and employees are passionate about
>95%
of employees participated in psychological safety DEI training
17%
higher communications employee engagement survey score compared to industry benchmark12
0
employee fatalities and TRIR lower than BLS industry averages
13%
higher team dynamics employee engagement survey score compared to industry benchmark12
352
Milestone Awards
* Benchmarks for the Transportation and Warehousing industry from third-party employee survey provider.

2022 ENVIRONMENT HIGHLIGHTS
>32%
decrease in our Scope 1 & 2 GHG emissions intensity from 2021
>11%
decrease in total Scope 1 & 2 GHG emissions from 2021
100%
carbon-neutral parcel shipments for two consecutive years
(see Page 21 for further details)
Acquired EcoVapor and its ZerO2TM technology, which enables operators to reduce up to 16,000 annual metric tons of CO2e emissions through the continual use of one E300 oxygen elimination unit yielding improved gas capture, where otherwise the gas would have been combusted and emitted to the atmosphere
(see Page 36 for further details)

About This Report
The information included in this report is subject to DNOW’s policies and requirements surrounding the disclosure of financial and non-financial data. The financial information included in this report was sourced from our Form 10-K filed with the SEC on February 16, 2023. All non-financial data included in this report was not subject to a third-party audit verification process.


Forward-Looking Statements
Certain information contained in this Sustainability Report may constitute forward-looking statements within the meaning of applicable securities laws, including, but not limited to, statements regarding our plans to: move forward with identified climate change opportunities, foster programs regarding diversity and inclusion and plans to seek opportunities to further integrate sustainability factors into investment decisions. Readers are cautioned not to place undue reliance on forward-looking statements, as they are subject to a number of assumptions and known and unknown risks and uncertainties that may cause the actual results, performance or achievements of DNOW to be materially different from any future results, performance or achievements expressed or implied by such forward-looking statements. The forward-looking statements contained herein are made as of the date of this document. We also describe risks and uncertainties in our reports filed with the SEC, including our Form 10-K for the year-ended December 31, 2022 (under the headings “Risk Factors” and “Information Regarding Forward- Looking Statements” and elsewhere) and our subsequent reports, which are available through the SEC’s EDGAR system at www. sec.gov, and on our website at dnow.com. DNOW assumes no obligation to update or otherwise revise these forward-looking statements, whether as a result of new information, future events, or otherwise.
SASB Index
The Sustainability Accounting Standards Board (“SASB”) framework aims to provide a standard for companies to disclose financially-material and decision- useful ESG information to investors and other stakeholders. The index below maps our performance under each of the suggested disclosure topics for the following two industries:
- Oil & Gas Services (Code EM-SV)
- Multiline and Specialty Retailers & Distributors (Code CG-MR)
According to SASB’s Sustainable Industry Classification System (SICS®), these two industry standards most accurately reflect our business operations. Other topics disclosed throughout this report beyond the scope of these standards are not reflected in this index.
| CODE | ACCOUNTING METRIC | UNIT OF MEASURE | 2021 RESPONSE | 2020 RESPONSE | 2019 RESPONSE |
| Greenhouse Gas Emissions | |||||
| EM-SV-110a.1 | Total fuel consumed | Gigajoules (GJ) | 216,873 |
248,228 |
286,930 |
| Metric tons carbon dioxide equivalent (MT CO2e) |
15,402 |
16,623 |
20,444 |
||
| Percentage renewable | Percentage (%) | 0% | 0% | 0% | |
| Percentage used in on-road equipment and vehicles | Percentage (%) | 99.8% | 99.8% | 99.7% | |
| Percentage used in off-road equipment | Percentage (%) | 0.2% | 0.2% | 0.3% | |
| EM-SV-110a.2 | Discussion of strategy or plans to address air emissions-related risks, opportunities, and impacts | N/A | Pages 35-42 | See 2021 Report | See 2021 Report |
| CODE | ACCOUNTING METRIC | UNIT OF MEASURE | 2021 RESPONSE | 2020 RESPONSE | 2019 RESPONSE |
| Energy Management | |||||
|
CG-MR-130a.1 |
Total electricity consumed |
Gigajoules (GJ) |
60,470 |
69,358 |
71,026 |
|
Metric tons carbon dioxide equivalent (MT CO2e) |
7,896 |
8,247 |
10,219 |
||
|
Total natural gas consumed |
Gigajoules (GJ) |
74,891 |
112,104 |
82,081 |
|
|
Metric tons carbon dioxide equivalent (MT CO2e) |
3,841 |
5,683 |
4,156 |
||
|
Total energy consumed |
Gigajoules (GJ) |
135,361 |
181,462 |
153,107 |
|
|
Percentage energy consumed that is grid electricity1 |
Percentage (%) |
45% |
38% |
46% |
|
|
Employee Health & Safety |
|||||
|
EM-SV-320a.1 |
Total recordable incident rate (TRIR) |
Rate |
0.94 |
0.92 |
0.91 |
|
Fatality rate |
Rate |
0 | 0 | 0 | |
|
Near miss frequency rate (NMFR) |
Rate |
Not Disclosed |
Not Disclosed |
Not Disclosed |
|
|
Total vehicle incident rate (TVIR) |
Rate |
0.86 |
0.80 |
0.63 |
|
|
Average hours of health, safety, and emergency response training for (a) full- time employees, (b) contract employees, and (c) short- service employees |
Hours |
Not available |
Not available |
Not available |
|
1 Calculated as purchased grid electricity consumption divided by total energy consumption, which includes natural gas consumption.
| CODE | ACCOUNTING METRIC | UNIT OF MEASURE | 2021 RESPONSE | 2020 RESPONSE | 2019 RESPONSE |
| EM-SV-320a.2 | Description of management systems used to integrate a culture of safety throughout the value chain and project lifecycle | N/A | Pages 26-27 | See 2021 Report | See 2020 Report |
| Data Security | |||||
| CG-MR-230a.1 | Description of approach to identifying and addressing data security risks | N/A | Page 24 | See 2021 Report | See 2020 Report |
| CG-MR-230a.2 CG-MR-230a.2 |
Number of data breaches | Number | 0 | 0 | 0 |
| Percentage involving personally identifiable information | Percentage (%) | 0% | 0% | 0% | |
| Number of customers affected | Number | 0 | 0 | 0 | |
| Labor Practices | |||||
| CG-MR-310a.3 | Total amount of monetary losses as a result of legal proceedings associated with labor law violations | Dollars ($) | See note 2 below | See note 2 below | See note 2 below |
| Employee Engagement, Diversity & Inclusion | |||||
| CG-MR-330a.1 | Percentage of gender and racial/ethnic group representation for (1) management and (2) all other employees | Percentage (%) | Pages 32 | See 2021 Report | See 2020 Report |
| CG-MR-330a.2 | Total amount of monetary losses as a result of legal proceedings associated with employment discrimination | Dollars ($) | See note 2 below | See note 2 below | See note 2 below |
2 Total monetary paid losses resulting from legal proceedings related to claims which contained allegations of employment discrimination or labor law violations for the year ending December 31, 2022 were less than $815K, or 0.22% of total warehousing, selling and administrative expenses.
| CODE | ACCOUNTING METRIC | UNIT OF MEASURE | 2021 RESPONSE | 2020 RESPONSE | 2019 RESPONSE |
| Business Ethics | |||||
| EM-SV-510a.1 | Amount of net revenue in countries that have the 20 lowest rankings in Transparency International’s Corruption Perception Index |
Percentage (%) of Total Revenues | 0.23% | 0.15% | 0.07% |
| EM-SV-510a.2 | Description of the management system for prevention of corruption and bribery throughout the value chain | N/A | Pages 18 | See 2021 Report | See 2020 Report |
| Critical Incident Risk Management | |||||
| EM-SV-540a.1 | Description of management systems used to identify and mitigate catastrophic and tail-end risks | N/A | Page 13, 15 | See 2021 Report | See 2020 Report |
| Product Design & Lifecycle Management | |||||
| CG-MR-410a.1 | Revenue from products third-party certified to environmental and/or social sustainability standards | Dollars ($) | Not available | Not available | Not available |
| CG-MR-410a.3 | Discussion of strategies to reduce the environmental impact of packaging | N/A | Pages 19-21 | See 2021 Report | See 2020 Report |
| Management of the Legal & Regulatory Environment | |||||
| EM-SV-530a.1 | Discussion of corporate positions related to government regulations and/or policy proposals that address environmental and social factors affecting the industry | N/A | Pages 15-17 | See 2021 Report | See 2020 Report |
| CODE | ACCOUNTING METRIC | UNIT OF MEASURE | 2021 RESPONSE | 2020 RESPONSE | 2019 RESPONSE |
| CG-MR-000.A | Number of retail locations | Number | 170 | 180 | 195 |
| Number of regional fulfillment centers | Number | 9 | 8 | 8 | |
| CG-MR-000.B | Total area of retail space | Square meters (m2) | 267,629 | 254,958 | 321,759 |
| Total area of regional fulfillment centers | Square meters (m2) | 91,552 | 87,836 | 87,836 |
TCFD INDEX
We are committed to increasing transparency and alignment of our reporting with the recommendations established by the Task Force on Climate-Related Financial Disclosures ("TCFD"). The TCFD has developed voluntary, consistent climate-related financial risk disclosures for use in providing information to stakeholders. Below is a summary of these disclosures in this report.
| CATEGORY | TCFD RECOMMENDATION | SUPPORTING RECOMMENDED DISCLOSURE | LOCATION OF DISCLOSURE |
|---|---|---|---|
| Governance | Disclose the organization's governance around climate-related risks and opportunities. | a) Describe the board's oversight of climate-related risks and opportunities. | Corporate Governance Oversight, Page 13 |
| b) Describe management's role in assessing and managing climate-related risks and opportunities. | |||
| Strategy | Disclose the actual and potential impacts of climate- related risks and opportunities on the organization’s businesses, strategy, and financial planning where such information is material. | a) Describe the climate-related risks and opportunities the organization has identified over the short-, medium-, and long-term. | Managing Risks & Opportunities, Page 15 Management of the Legal & Regulatory Environment, Page 17 |
| b) Describe the impact of climate-related risks and opportunities on the organization’s businesses, strategy, and financial planning. | |||
| c) Describe the resilience of the organization’s strategy, taking into consideration different climate-related scenarios, including a 2°C or lower scenario. | At this time, DNOW has not conducted a 2°C or lower scenario analysis. We are, however, committed to continuing to enhance our understanding of climate-related risks and opportunities and the ways in which they impact our business, strategy, and financial planning, and will assess this initiative in the future. | ||
| Risk Management | Disclose how the organization identifies, assesses, and manages climate-related risks. |
a) Describe the board’s oversight of climate- related risks and opportunities. | Managing Risks & Opportunities, Page 15 |
| b) Describe the organization’s processes for managing climate-related risks. | Management of the Legal & Regulatory Environment, Page 17 | ||
| c) Describe how processes for identifying, assessing, and managing climate-related risks are integrated into the organization’s overall risk management. | |||
| Metrics & Targets | Disclose the metrics and targets used to assess and manage relevant climate-related risks and opportunities where such information is material. | a) Disclose the metrics used by the organization to assess climate-related risks and opportunities in line with its strategy and risk management process. | SASB Index. Page 44 |
| b) Disclose Scope 1, Scope 2, and, if appropriate, Scope 3 GHG emissions, and the related risks. | |||
| c) Describe the targets used by the organization to manage climate-related risks and opportunities and performance against targets. | We have not yet set climate-specific targets, as we’re focused on establishing our GHG emissions baseline and enhancing our approach to ESG data collection. We will continue to evaluate the feasibility and relevance of setting climate-specific targets in the future. |
UN SDG Alignment
| UN SDG Topic | UN Sustainable Development Goal | DNOW Goal Progress and Key Performance Indicators | Section, Page # |
 |
Ensure healthy lives and promote well-being for all. |
|
Workforce Health & Safety |
 |
Ensure inclusive and equitable quality education and promote lifelong learning opportunities for all. |
|
Employee Engagement & Development |
 |
Achieve gender equality and empower all women and girls. |
|
Corporate Governance Oversight Workforce Diversity & Inclusion |
 |
Ensure access to affordable, reliable, sustainable and modern energy for all. |
|
Supply Chain Stewardship Page 19 Delivering Sustainable Energy |
 |
Promote sustained, inclusive and sustainable economic growth, full and productive employment and decent work for all |
|
Corporate Governance Oversight Supply Chain Stewardship Page 19 Workforce Health & Safety Workforce Diversity & Inclusion |
 |
Build resilient infrastructure, promote inclusive and sustainable industrialization and foster innovation. |
|
Supply Chain Stewardship Page 19 Delivering Sustainable Energy |
 |
Ensure sustainable consumption and production patterns. |
|
Supply Chain Stewardship Page 19 DNOW Environmental Performance Page 41 |
 |
Take urgent action to combat climate change and its impacts. |
|
Managing Risks & Opportunities Page 15 Supply Chain Stewardship Page 19 Delivering Sustainable Energy DNOW Environmental Performance TCFD Index Page 49 |

|
Promote peaceful and inclusive societies for sustainable development, provide access to justice for all and build effective, accountable and inclusive institutions at all levels. |
|
Corporate Governance Oversight Business Ethics & Payments Transparency Page 18 |

|
Strengthen the means of implementation and revitalize the global partnership for sustainable development. |
|
Our Sustainability Reporting Framework Page 10 UN SDG Alignment Page 50 |
